AIM Annual Report 2024-25
AIM Annual Report 2024-25
File: AIM2024-25.pdfAIM Annual Report 2024-25
File: AIM2024-25.pdfPoster presented at the Office of Strategic Consulting's Showcase 2023, an event that is "designed to celebrate and strengthen a culture of innovation and continuous improvement at UW–Madison." AIM staff presented in collaboration with colleagues from the School of Business & School of Education.
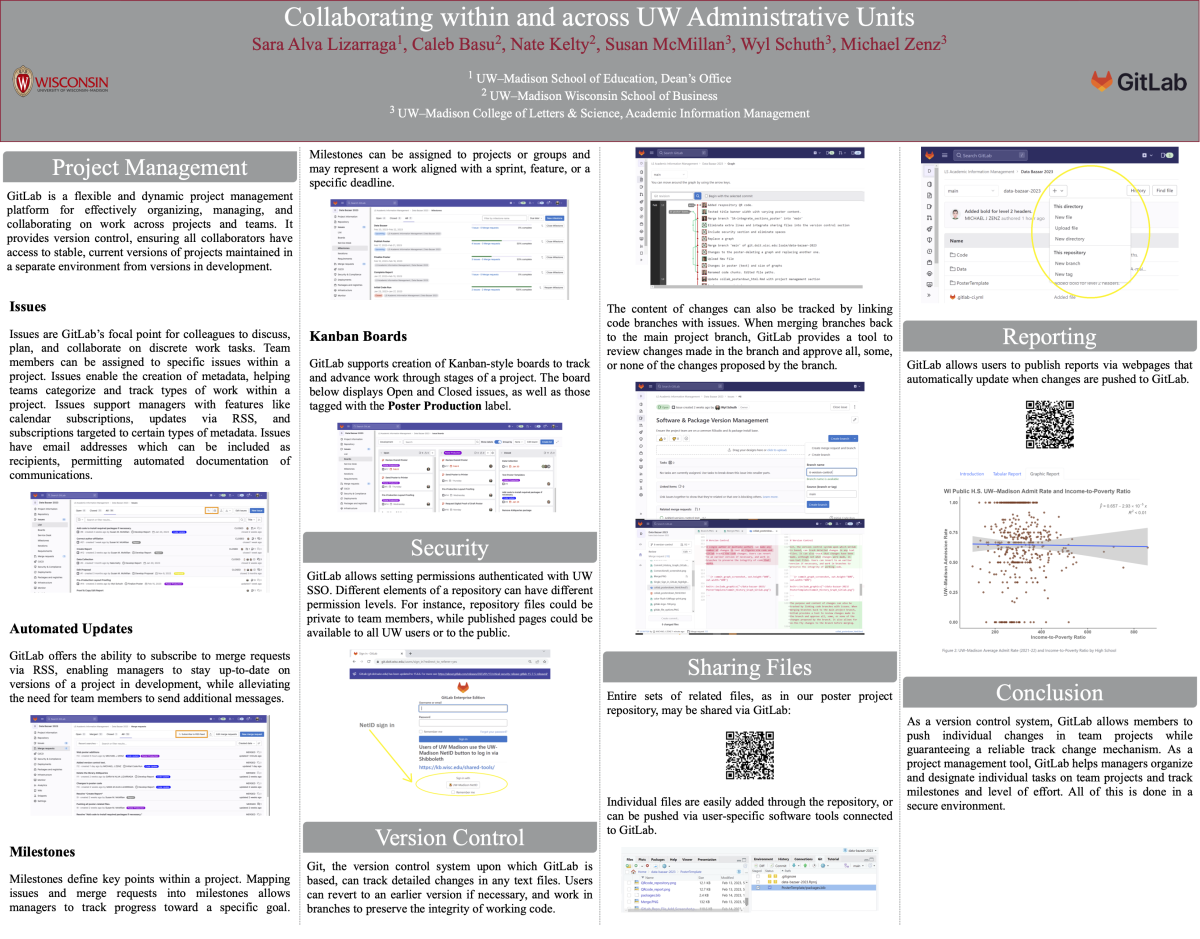
Administrative staff across UW—Madison are using a variety of tools to do similar tasks, from project management to data analysis and visualization. GitLab allows staff members to use their own preferred tools and still collaborate on everyday tasks. Our poster, created by Policy & Planning Analysts from the School of Education, Wisconsin School of Business, and the College of Letters & Science, will illustrate how we use GitLab to meet challenges related to:
GitLab is not just a tool for software development. We provide information on how to get started with GitLab, concrete examples of collaborative work, and challenges.
Sara M. Alva Lizarraga, Policy & Planning Analyst, School of Education
Caleb Basu, Policy & Planning Analyst, Wisconsin School of Business
Nate Kelty, Policy & Planning Analyst, Wisconsin School of Business
Susan M. McMillan, Policy & Planning Analyst, Academic Information Management, College of Letters & Science
Wyl Schuth, Policy & Planning Analyst, Academic Information Management, College of Letters & Science
Michael Zenz, Policy & Planning Analyst, Academic Information Management, College of Letters & Science
Mike and Ozzyie Chen from DoIT co-presented at the RedLantern (since acquired by CollegeSource) User Conference on the development of the UW-Madison DARSX electronic exception workflow. Dubbed "Web-X" at the time, this was the first public demonstration of the need and solutions that later became DARSX at UW-Madison.

Mike and Ozzyie Chen from DoIT co-presented at the RedLantern (since acquired by CollegeSource) User Conference on the development of the UW-Madison DARSX electronic exception workflow. Dubbed “Web-X” at the time, this was the first public demonstration of the need and solutions that later became DARSX at UW-Madison.
A follow-up to 2009, Mike presents the next phase of development and implementation of DARSX. A pilot at the time, this presentation featured a live demonstration of the system's functionality and walked attendees through the decision process that led to them.
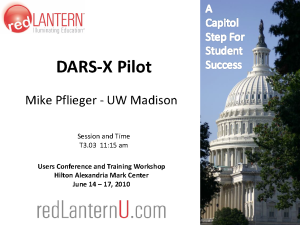
A follow-up to 2009, Mike presents the next phase of development and implementation of DARSX. An L&S pilot at the time, this presentation featured a live demonstration of the system’s functionality and walked attendees through the decision process that led to them.
Poster and scrolling presentation on the innovative DARSX electronic exception workflow system, created by Mike Pflieger in collaboration with Ozzyie Chen from DoIT. The poster and presentation exhibit the need to innovate and leverage DARS encoding data to eliminate the work producing, distributing, updating, collecting, and archiving customized exception forms for each L&S program.
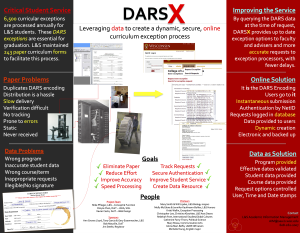
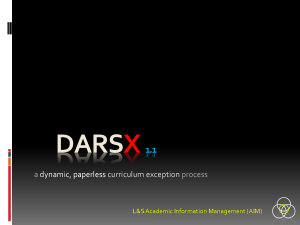
Poster and scrolling presentation on the innovative DARSX electronic exception workflow system, created by Mike Pflieger in collaboration with Ozzyie Chen from DoIT. The poster and presentation exhibit the need to innovate and leverage DARS encoding data to eliminate the work producing, distributing, updating, collecting, and archiving customized exception forms for each L&S program.
Susan McMillan shared her thoughts with the UW-Madison analyst community of practice on basic statistics for practical daily work. This presentation covers a variety of statistical concepts and categories, such as percentages, descriptive statistics, data quality, distributions, trends, relationships, and common complications.
Susan McMillan gave this presentation for UW-Madison Data Wonks community of practice on basic statistics for practical daily work. This presentation covers a variety of statistical concepts and categories, such as percentages, descriptive statistics, data quality, distributions, trends, relationships, and common complications.
Susan McMillan promotes data literacy with her "Everyone Counts: Data for Non-Analysts" presentation for anyone who wants to use data in their work, but who doesn't have a background or training. This presentation introduces concepts with the simple example of "counting" and how even that requires context and the expertise of the person doing the counting.
Susan McMillan promotes data literacy with her “Everyone Counts: Data for Non-Analysts” presentation for anyone who wants to use data in their work, but who doesn’t have a background or training. This presentation introduces concepts with the simple example of “counting” and how even that requires context and the expertise of the person doing the counting.
Susan McMillan continues her data literacy efforts with her "Everyone Counts: Interpreting Data" presentation intended for non-analysts. This episode builds on the highly praised first episode and focuses on concepts like pattern recognition to shed light on how interpreting data and making responsible inferences can be challenging.
Susan McMillan continues her data literacy efforts with her “Everyone Counts: Interpreting Data” presentation intended for non-analysts. This episode builds on the highly praised first episode and focuses on concepts like pattern recognition to shed light on how interpreting data and making responsible inferences can be challenging.
Michael Zenz and Susan McMillan co-presented on how AIM uses degree audit data for automations, analyses and operational reports, and curricular analysis. Their slides cover the concept that everything in uAchieve is data that can be joined and used for more essential needs than just auditing degrees. Their presentation shows the basic data structures and joins and how they use this data for degree clearance and curricular analysis using batch audit output. They also touch on construction of "analytic audits" in uAchieve that process student data to produce targeted output for specific needs, such as scholarship awards.
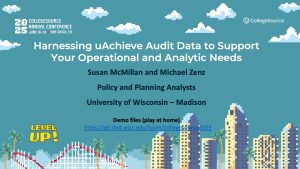
Michael Zenz and Susan McMillan co-presented on how AIM uses degree audit data for automations, analyses and operational reports, and curricular analysis. Their slides cover the concept that everything in uAchieve is data that can be joined and used for more essential needs than just auditing degrees. Their presentation shows the basic data structures and joins and how they use this data for degree clearance and curricular analysis using batch audit output. They also touch on construction of “analytic audits” in uAchieve that process student data to produce targeted output for specific needs, such as scholarship awards.
Susan, Michael, and Wyl presented how they solved the problem of fragmented workflows in a collaborative workplace by unifying document and report generation using Quarto in combination with R-Studio and Gitlab.
Susan, Mike and Wyl presented how they solved the problem of fragmented workflows in a collaborative workplace by unifying document and report generation using Quarto in combination with R-Studio and Gitlab.